Перевод Статьи:
![]()
![]()
![]()

If you want to know how the quotes of the asset you have chosen will change in the future, then it will not be superfluous to study technical analysis, or at least its most important points.
The advantage of this approach is that you do not need to take into account external factors of influence, study the economic situation in the world, country and region. You just take into account some patterns, and build a forecast based on them.
Is Technical Analysis the Key to Big Profits?
At first, you might think that this is a guaranteed way to increase your capital! But in practice, everything turns out to be not so rosy. Each of the methods of market technical analysis is an option that takes into account its own patterns.
Indicators can serve as a confirming tool, but their readings may differ. The reason lies in the analysis of different components. However, it is possible to identify the basic postulates.
Here they are:
- If we talk about the study of the Forex market, then the main way to implement the task is technical analysis. It allows you to make a forecast of changes in quotes for the future, based on the dynamics of prices of the past. In the stock market, this approach is also applicable, but to a lesser extent. The reason is that working with currencies involves making deals in the short term, and with stocks in the long term. In the second case, the fundamental type of research shows higher efficiency, and the technical analysis of stocks online is more often used to find a local entry or exit point.
- To predict price changes, an analysis of “charts” is carried out – these are time series of prices. It is allowed to use additional statistical data, in particular, trading volume. Technical analysis of financial markets deals exclusively with the fact that the movement of value occurs in a certain direction. However, the reasons for this movement are not taken into account. If you correctly identify the trend, you will understand what to do with an already opened position, and whether it is worth entering the market with a new volume. A combination of conditions ensures income in any market.
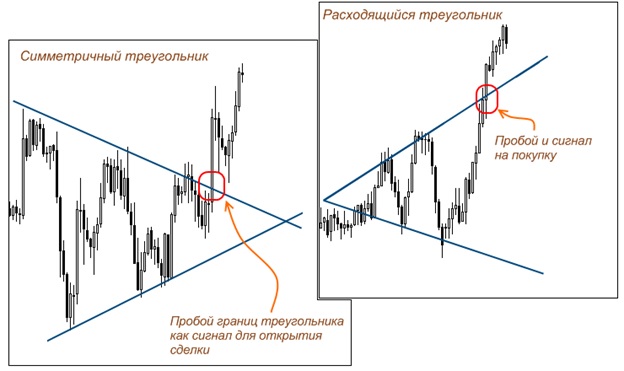
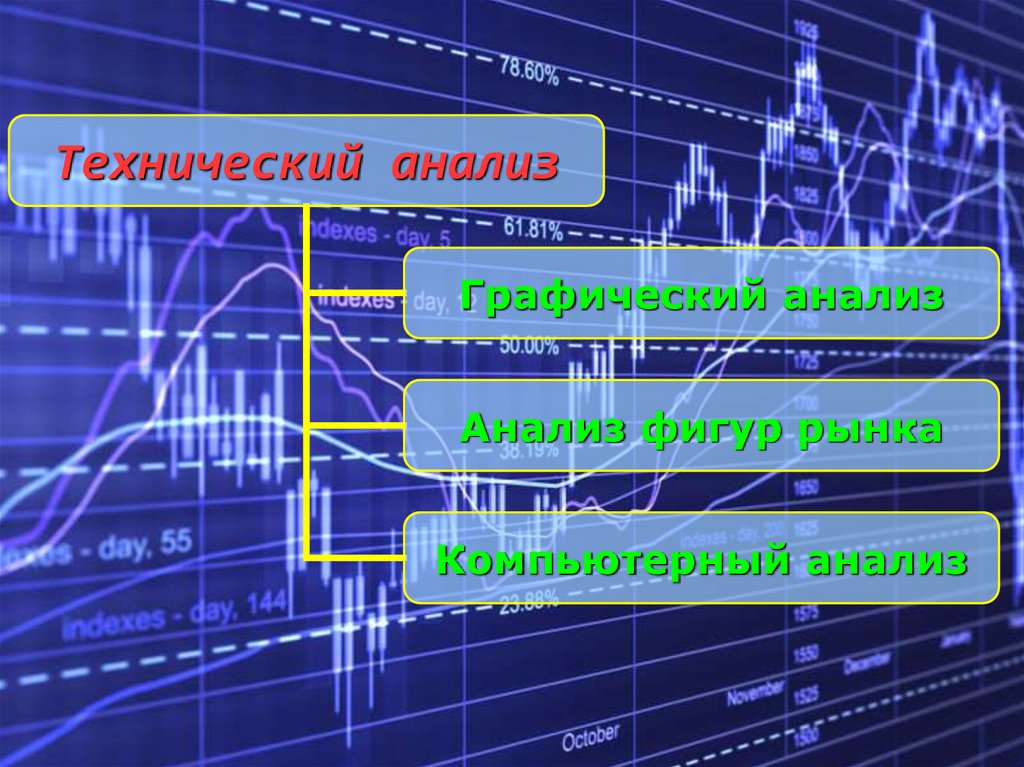
- Often, when analyzing the currency market, specialists look for confirmation of their guesses through indicators, technical patterns, Japanese candlesticks and graphical analysis – these are all varieties of the technical approach.

Textbook Axioms
When you start learning the main points of technical analysis for beginners, you are offered to remember:
- All the information you need to analyze quotes is already reflected in price changes, and is included in the trading volume. The development of the market is predicted by the dynamics of the ratio of these factors.
- Prices do not move chaotically, but according to certain trends. The time series can be divided into intervals during which price changes occur in one direction. This explains the smooth wave-like shape of the charts. It consists of peaks when the price rises and dips when it falls. Based on this, there are three main trends in the development of the market: upward (predominance of bullish sentiment), downward (decrease in values), sideways trend (when the price remains unchanged).
- History repeats itself. This statement of technical analysis is related to the stock exchange, and even to the history of mankind. The reason is that market participants always react in the same way to identical factors. If you know the different reactions of the market crowd to the events of the past, you can easily predict the situation in the future. This axiom has become the basis for the development of a number of traditional patterns for predicting how prices will behave in the near and long term. The best method for market analysis is the Japanese candlestick chart. Its creators are considered to be rice merchants from the Land of the Rising Sun.
Relationship and Varieties of Market Research Methods
It should be noted that graphical and technical analysis are very closely intertwined, because the former is a particular complement to the latter. Charting is considered to be the main and oldest method. This approach shows the behavior of prices through the formation of typical patterns indicating the direction of movement. These shapes can be of several types. Some signal that the trend will continue, while others say that it will soon be reversed. The accuracy of this method can be questioned, but its strengths are convenience, efficiency and ease of use.

The mathematical method of constructing a forecast is more complex and time-consuming. It is based on mathematical formulas and calculations. It is this approach that allows you to build market indicators that indicate whether the market is overbought or oversold.
Technical analysis of the market using a mathematical approach is divided into 2 directions – trend and flat. Determining the state of the market is tied to the position of the middle line, as well as the location of the time series of prices relative to it.
The tricky part is finding the right formula. If we consider a flat, the refraction of the line indicates proximity to price extremes. If you scale each of the methods, then flat trading can look like trend trading on different timeframes, and vice versa. There is no relative point from which to find the ultimate truth.
The cyclic approach is based on the theory of cycles. It states that all changes are subject to the change of day and night. As a result of this trading approach, entire trading systems are built (we are talking about algorithms, or making a profit with the help of robotic programs). It turns out that technical analysis is used in trading, with the probability of accurate forecasting of price movement increases. This allows you to receive a stable income in the foreign exchange market.
Graphical and technical analysis for beginners