


Перевод Статьи:
![]() Français
Français ![]() Português
Português ![]() Русский
Русский
Price action patterns did not come to technical analysis by chance. Charles Dow claimed that all the necessary information is already included in the price. Even taking into account economic and political news. Instead of reading miles of news announcements and analytical calculations, study the very essence of price movement.
Price Action patterns have not become obsolete to this day
The advantage offered by these elements of technical analysis is that the trader’s mind is freed from unnecessary information, allowing him to clearly see everything that is happening on the exchange. Until now, all Price Action patterns are popular for use in trading because they are:
- Universal.
- Relatively simple.
- Very popular. That is why Price Action patterns have become widespread and recognizable.
The method demonstrates maximum efficiency in long-term trading. Here, the main timeframe is the daily segment. The benefit of such a chart lies in the ability to weed out unnecessary market noise, which has the form of chaotic price fluctuations. Another thing that contributes to comfortable trading is the reduction of time spent on market analysis. Sometimes just 15 minutes of work with the schedule during the day is enough.
A clean schedule and a clear future. A merchant’s dream?
Speculators who consider themselves followers of the method abandon indicators, trading advisors, and technical assistants of any other type. Making an assumption about the further movement of the market takes into account the behavior of the asset’s quotes at a particular point in time.
In the system, the working signals are the so-called candlestick patterns. These are patterns that repeat themselves with some periodicity. They are called setups, or Price Action patterns and methods.
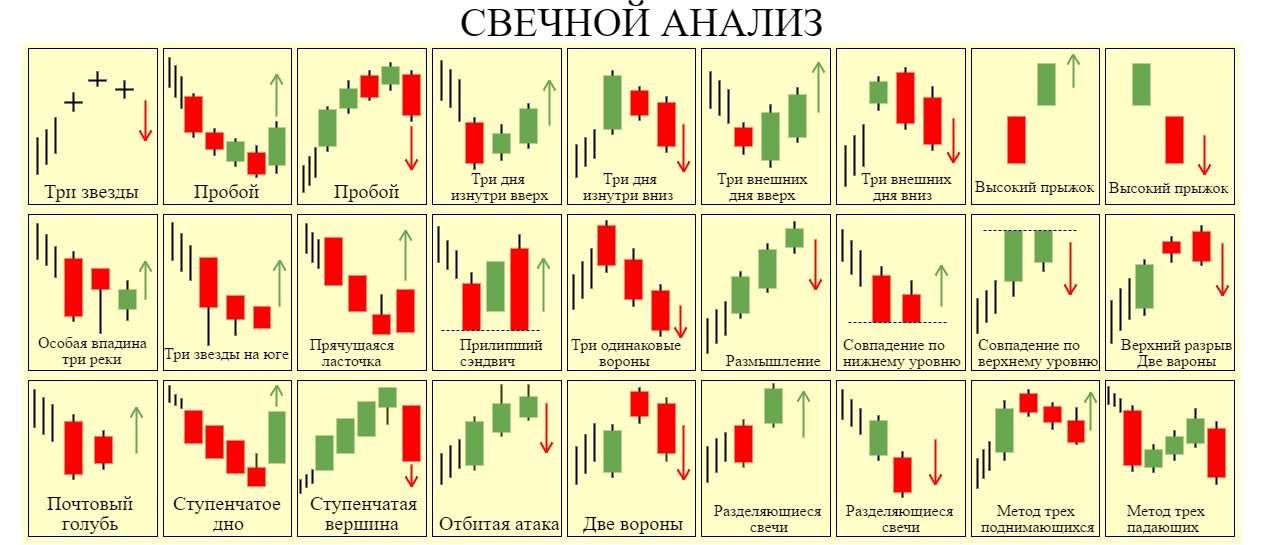
The emergence of such patterns is explained by the fact that in the currency market, for example, situations are constantly repeated. The mood of market participants fits well into such behavioral patterns. A trader gets the opportunity to predict the dynamics of quotes in this way.
For traders working with this method, it will be enough to perfect two or three effective signals of strong Price Action patterns, for stable trading in profit. The only thing that is needed is the ability to track down the emergence of such price action patterns.
Is the rejection of indicators justified?
You need to understand that the indicators are based on the usual formulas from the discipline of mathematics. The price values pass through them. However, you should not perceive the signals of technical indicators in the same way as the signals of traffic lights. But many traders make just such a mistake and later pay dearly for it.
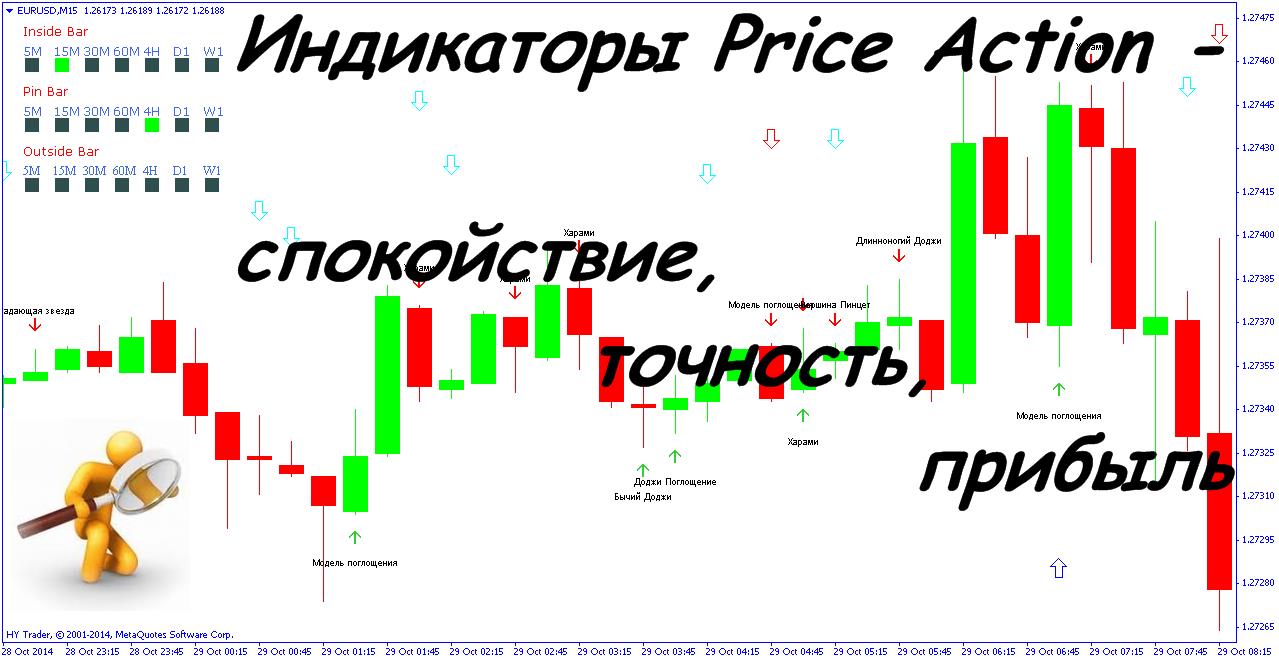
The market will not forgive you if you open orders using a simplified approach. And even the Price Action Pattern Indicator uses it! When the green light comes on, the trade is opened upwards, and the red light is opened downwards. It doesn’t matter whether an indicator or an Expert Advisor follows a trend or tries to calculate whether the market is oversold or overbought – the initial basis is only the price indicators. Nothing else counts.
Accurate forecasts for Price Action are impossible!
By looking at Price Action patterns, what it is, trying to understand more concretely, you can compare the Forex market to the weather. It is rarely the same. Change happens all the time. Each time, the situation is not the same as yesterday. It is impossible to calculate the interbank market – this system is not linear. Every second, it is influenced by hundreds of political and economic factors from all over the world. These factors cause the movement of the price of assets, and quotes move the readings of the indicators.
The Price Action candlestick pattern strategy allows the trader using it to interact with the price. It means being closer to the original source. At the same time, a trader who works only with indicators seems to be one step further away from what he earns on.
When working with reversal Price Action patterns , or those that indicate the continuation of the trend, it is recommended to use some oscillators as an additional level of protection against incorrect trades. This circumstance will not complicate the strategy, but it will contribute to an increase in its profitability.
If you use the Price Action pattern reference, you can find a detailed description of how to work with each pattern. The general approaches are identical. In the Forex currency market, a trend as a price movement is formed with periodic pullbacks. To ride these waves, it is necessary to hunt down the extreme values of price peaks and troughs. If you manage to enter a trade on price pullbacks against the trend, then such a position will be considered good. In order to be able to detect such positions, you need to see the general trend. Trend confirmation should occur in rising or falling highs or lows. It all depends on whether we are talking about a bullish or bearish trend.
Action Plan for Success
Perhaps you will choose 7 popular Price Action patterns to work with, or give preference to less popular options (Shooting Star, Harami, Bullish Engulfing, and others). In any case, stick to the following sequence of actions:
- Wait for the chart to approach the resistance or support level. The first option is considered more reliable, because, often, the formation of bullish trends is a little slower, and stretches over time, compared to bearish ones. The rise in price takes longer than its collapse.
- We wait for the Japanese candlesticks near the level line to form a certain pattern. The more complex it is, the more accurate the signal will be.
- Looking for confirmations of the pattern so that it is fully formed and the chart begins to move in the right direction.
- Open an order in the desired direction.
The advantages of the system are working directly with the price, quick response to any changes, and more frequent opening of profitable orders with high accuracy. There is also versatility, which allows you to make money in a flat and trend. Higher timeframes, from H1 and higher, are relevant for use.
https://www.youtube.com/watch?v=s–4Hosolrk